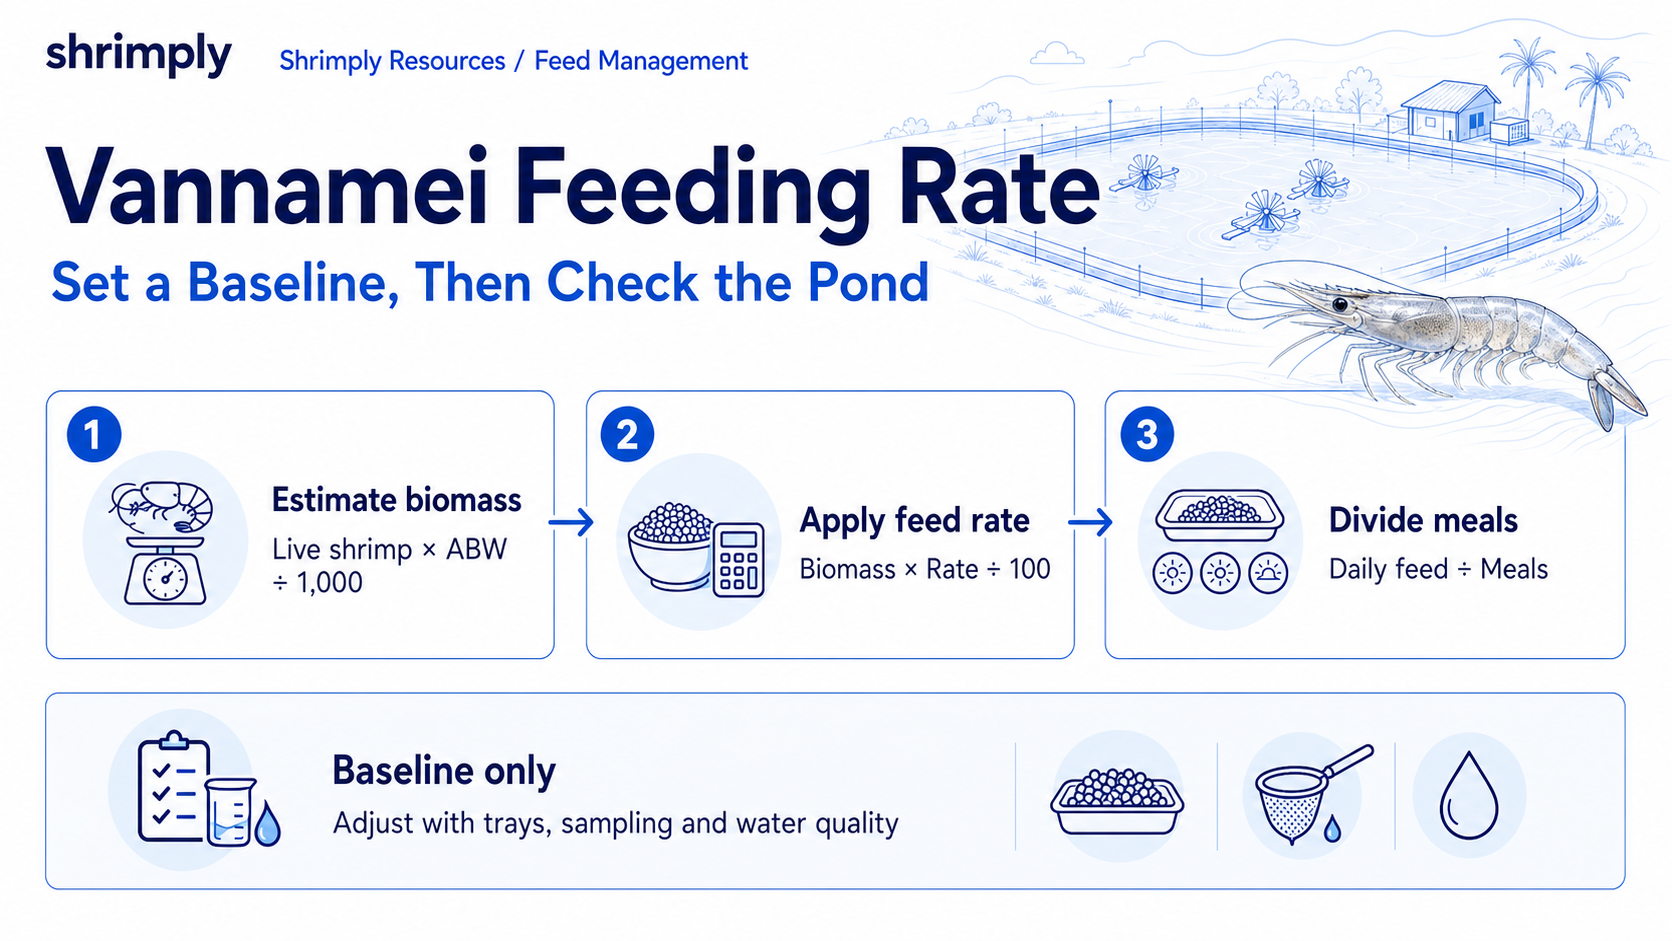
Quick answer: calculate a baseline, then check the pond
Estimate standing biomass, apply the feeding-rate percentage for the latest valid average body weight (ABW), then divide the result into the farm's planned meals.
The answer is only a starting ration. Biomass error, partial harvests, natural food, feed quality, temperature, dissolved oxygen, and shrimp health can all change the amount the pond can use.
Check several trays and review recent sampling, mortality, harvest, and water-quality records before increasing or maintaining the calculated amount.
Baseline feeding-rate curve
These are the reference points in Shrimply's shared grow-out curve. The calculator uses linear interpolation between points so the rate changes smoothly as ABW rises.
Published schedules differ because feed formulation, stocking density, natural productivity, water stability, and target FCR differ. Treat this curve as a consistent management baseline and compare it with the feed manufacturer's table and pond response.
Scroll sideways to see all columns.
| ABW reference point | Baseline rate (% biomass/day) |
|---|---|
| 1.65–3.0 g | 6.5% |
| 5.0 g | 5.5% |
| 7.5 g | 4.2% |
| 10.5 g | 3.6% |
| 14.0 g | 3.3% |
| 17.5 g | 3.1% |
| 21.0 g | 2.9% |
| 25.0 g | 2.7% |
| 29.0 g | 2.5% |
| 33.0 g | 2.3% |
| > 33.0 g | 2.1% |
Interactive Vannamei Shrimp Feed Calculator
Use the calculator for shrimp at or above 1.65 g ABW. Enter known standing biomass, or estimate it from initial stocking, survival, cumulative partial harvest count, and ABW.
The tool uses the same linear interpolation curve as Shrimply's shared pond calculations. It then divides the baseline daily ration by your selected meal count and calculates the amount placed on each monitoring tray.
Vannamei Shrimp Feed Calculator
Calculate baseline feeding rate (% biomass), meal-by-meal splits, and starting tray rations based on current ABW and standing biomass.
Automatically Tracked Inside Shrimply
This Feeding Rate (FR) curve is shared with Shrimply's farm tools. Feed records can reduce inventory, while biological sampling records do not. When enough pond records exist, Shrimply also compares feed-based and recorded biomass estimates so the team can investigate a mismatch.
How to calculate daily feed for shrimp: The biomass formula
To calculate a baseline daily allocation, use current standing biomass and the feeding-rate percentage for the latest valid ABW.
The primary calculation formula is: Daily Feed (kg) = Standing Biomass (kg) × [Feeding Rate (%) ÷ 100]
If biomass is unknown: Current Population = (Initial Stock × Survival %) − Cumulative Partial Harvest Count. Standing Biomass (kg) = Current Population × ABW (g) ÷ 1,000.
Worked example 1: At 12.0 g ABW, the shared curve interpolates a 3.47% baseline. A 3,500 kg standing biomass gives 3,500 × 0.0347 = 121.5 kg/day, or about 30.4 kg per meal across four meals.
Worked example 2: From 200,000 stocked shrimp at 80% survival with 20,000 already harvested, current population is 140,000. At 8.0 g ABW, biomass is 1,120 kg and the interpolated rate is 4.10%, giving 45.9 kg/day before pond-response adjustments.
Feed tray management: keep the method consistent
Feed trays (also called check trays, lift nets, or anco) help the team compare feed response over time. They do not measure the appetite of every shrimp in the pond.
Published commercial schedules use different tray percentages and check times by shrimp size. The calculator defaults to 1.2% of each meal across all selected trays; change it to match the farm's written procedure and keep placement, timing, and tray loading consistent.
Use several representative trays. Avoid placing every tray in one current pattern, a stagnant corner, or heavy sludge, because location can distort the result.
- All trays clean once: Record the result, but do not increase feed from one observation alone. Confirm the pattern, recent growth, and water quality.
- More than 10% remains on several trays: Reduce the next ration according to the farm procedure and check dissolved oxygen, temperature, pH trend, weather, and shrimp behaviour.
- Trays disagree: Check feed distribution, tray position, current, sludge, and whether every tray was loaded and lifted at the same time.
- Feed response stays weak or mortality rises: Hold further increases and seek technical or aquatic-animal-health support; tray results alone cannot diagnose disease.
Water and weather checks before feeding
Dissolved oxygen: Check the current reading and recent trend before feeding, especially around pre-dawn and after unstable weather. If DO is below the farm target or still falling, prioritise aeration, delay or reduce the meal, and recheck before resuming.
Temperature: Feeding response changes with temperature and shrimp size. Research shows that the temperature for fastest growth is size-specific, so a single temperature multiplier is not reliable for every pond.
Rain, plankton change, pH movement, and salinity change: Compare conditions with the pond's normal range and recent tray response. Use smaller, reversible feed changes and confirm the next observation rather than applying an automatic fixed cut.
Natural food and feed quality: Pond productivity, pellet stability, palatability, and nutrient density can change compound-feed intake. Follow the feed label and investigate storage or feed-quality problems when tray response changes suddenly.
How Shrimply automates feeding rate and biomass tracking
Shrimply combines initial stocking, recorded mortality, cumulative harvests, and the latest valid MBW to estimate current population and biomass. Missing or outdated records still make the estimate less reliable, so the app does not remove the need for field checks.
The feeding-rate curve in this page is shared with Shrimply's pond calculations. When enough suitable records exist, the pond view can compare feed-based biomass with recorded biomass and flag a repeated mismatch for investigation.
Actual feeding records can deduct feed inventory. Sampling records store biological observations such as MBW and feed context but do not deduct inventory, preventing a sample from being counted as a warehouse movement.
Warning signs of feeding allocation errors
Treat these as observations that require checking, not as proof of one cause:
- Possible over-allocation: Repeated feed left on several trays, worsening FCR, rising feed-to-biomass mismatch, deteriorating bottom condition, or a downward pre-dawn DO trend.
- Possible under-allocation: Repeatedly clean trays together with weak growth, aggressive edge feeding, or a daily ration consistently below the biomass baseline.
- Possible distribution problem: Tray results differ sharply by location or size variation widens. Check broadcast coverage, current, tray placement, sampling method, and population estimates before blaming feed amount alone.
- Possible data problem: A sudden improvement or decline appears after missing mortality, harvest, feed, or MBW records. Correct the records before making a large ration change.
When to stop and get specialist help
Escalate when mortality continues, shrimp show abnormal swimming or appearance, feed response remains weak across several meals, water quality cannot be stabilised, or the pond does not improve after cautious corrections. Feed trays and calculator results cannot confirm an infectious disease.
What to apply on the farm
- Use the latest valid MBW and a population estimate that includes mortality and cumulative harvests.
- Calculate the baseline ration and divide it using the farm's meal schedule.
- Load, place, and check several trays with the same method each time.
- Review dissolved oxygen, temperature, pH trend, weather, and shrimp behaviour before increasing feed.
- Make small, reversible changes and confirm the next tray and growth response.
- Record actual feeding separately from biological sampling so inventory and FCR remain trustworthy.
What is the recommended feeding rate for Vannamei shrimp?
There is no single safe rate for every pond. Shrimply's calculator uses a grow-out baseline that falls from 6.5% of biomass per day at 1.65–3 g ABW to 2.1% above 33 g, but the final ration still depends on biomass accuracy, feed, natural food, temperature, dissolved oxygen, and observed feed response.
How do you calculate daily feed for shrimp?
Multiply standing biomass by the feeding-rate percentage and divide by 100: Daily feed (kg) = biomass (kg) × rate (%) ÷ 100. A 3,000 kg biomass at a 3.3% baseline gives 99 kg/day before tray and water-quality adjustments.
How many times per day should Vannamei shrimp be fed?
Commercial schedules commonly split feed into several meals, with frequency depending on shrimp size, feed stability, feeding method, labour, and pond conditions. Use the feed label and farm procedure as the starting schedule, then compare several trays and growth records before changing it.
How much feed should be placed on shrimp feed trays (anco)?
The calculator defaults to 1.2% of each meal spread across all trays, but the control can be changed to match the farm procedure. Published commercial schedules use different tray percentages by shrimp size, so keep the method consistent and interpret the trend rather than treating one percentage as universal.
How long should you wait before checking shrimp feed trays?
A practical starting window is about 2.5 hours for small juveniles, 1.5–2.0 hours through mid-grow-out, and 1.0–1.5 hours for larger shrimp. Match the timing to pellet water stability, shrimp size, feeding method, and the farm's established tray procedure.
How does water temperature and dissolved oxygen affect shrimp feeding rates?
Both affect feeding, but the response changes with shrimp size and the speed of the water-quality change. If dissolved oxygen is below the farm target or falling, delay or reduce the meal, restore aeration, and recheck before feeding; do not rely on one universal percentage cut.
Does Shrimply automatically calculate feed rates and biomass?
Shrimply calculates pond metrics from stocking, mortality, harvest, MBW, and feed records, and uses the same feeding-rate curve as this calculator. When enough records exist, it can show a feed-to-biomass mismatch for the team to investigate; it does not prove appetite or diagnose a cause.
Aquaculture engineers and vannamei shrimp farm practitioners dedicated to precision pond data, evidence-based water quality management, and biological yield optimization.
M.Sc. in Aquatic Animal Nutrition, 14+ years commercial vannamei feed formulation and feeding rate optimization
Shrimp feed management software
Explore how shrimp feed management software connects with this farm guide in Shrimply.
Improving FCR in Shrimp Farming: How to Use Feed Conversion Ratio Correctly
Understand shrimp feed conversion ratio, why FCR matters, what can distort it, and how farms can improve FCR with better feed, biomass, mortality, and harvest records.
Shrimp Feed Index: How to Calculate Daily Feed Without Guessing
Learn how the shrimp feed index method estimates daily feed from DOC, population, and target ADG—and how to adjust it using real pond data.
Shrimp farming resources library
Browse more practical Shrimply guides for vannamei farm operations and management.